Introduction
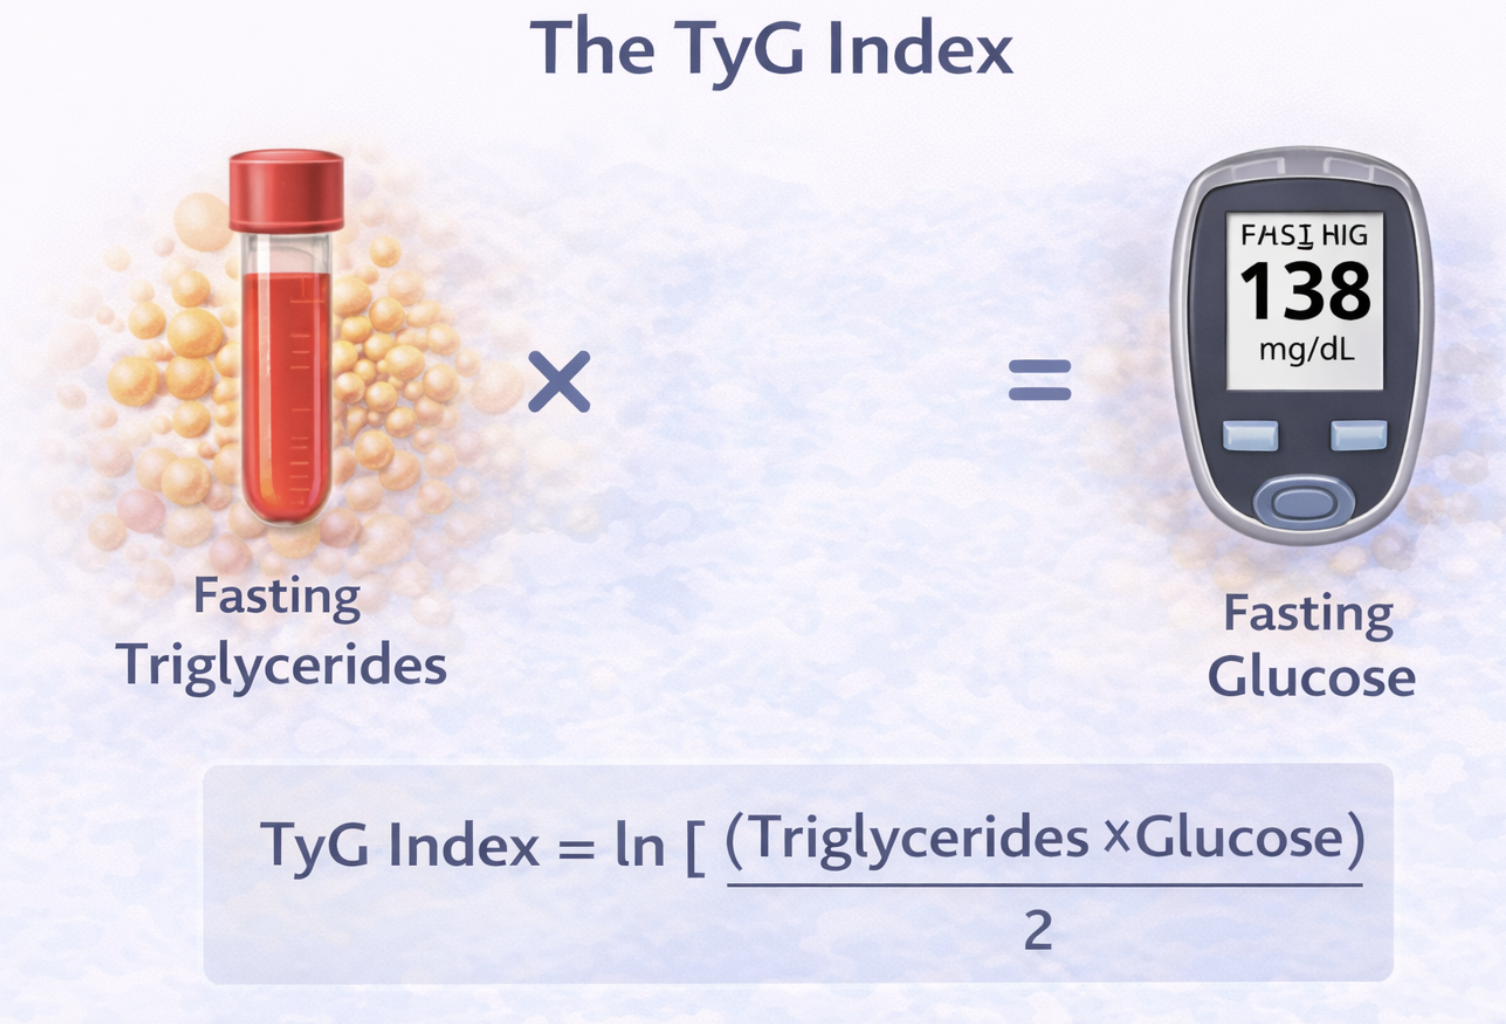
The Triglyceride–Glucose Index (TyG Index) has emerged as a practical marker of insulin resistance in both metabolic research and clinical evaluation.
Because insulin resistance is a central feature of metabolic syndrome, the TyG Index is also used as an indicator of broader cardiometabolic risk. It provides a simple way to assess underlying metabolic dysfunction using laboratory tests that are already part of routine care.
What Is the TyG Index?
The TyG Index is a calculated marker derived from two common blood measurements:
- fasting triglycerides
- fasting glucose
These values reflect two key aspects of metabolic physiology:
- lipid metabolism (triglycerides)
- glucose regulation (fasting glucose)
When combined into a single index, they provide an indirect estimate of insulin resistance.
The TyG Formula
The TyG Index is calculated using:
TyG Index = ln [ (Triglycerides × Glucose) / 2 ]
In this formula:
- triglycerides are measured in mg/dL
- fasting glucose is measured in mg/dL
- ln represents the natural logarithm
In practice, this calculation is usually performed using online calculators or automated systems.
Why Insulin Resistance Matters
Insulin resistance lies near the center of many metabolic disorders.
When tissues become less responsive to insulin, several changes occur:
- increased glucose production by the liver
- reduced glucose uptake by muscle
- increased lipid synthesis
- elevated circulating triglycerides
These disturbances affect multiple organ systems, including:
- liver
- pancreas
- adipose tissue
- vascular system
Because insulin resistance develops gradually and may remain silent for years, identifying indirect markers such as the TyG Index can be clinically useful.
Why Triglycerides and Glucose?
Triglycerides and glucose capture two critical components of metabolic regulation.
Triglycerides are produced largely in the liver and reflect lipid handling. Elevated levels often indicate increased hepatic fat production and altered lipoprotein metabolism.
Fasting glucose reflects the balance between hepatic glucose output and peripheral glucose uptake.
When insulin signaling becomes impaired, these two systems become dysregulated together. For this reason, combining triglycerides and glucose provides a useful window into metabolic health.
Relationship to Insulin Resistance
Studies have shown that the TyG Index correlates with more direct measures of insulin resistance, including the hyperinsulinemic–euglycemic clamp.
Because that technique is complex and not practical for routine use, the TyG Index offers a simpler and more accessible alternative for estimating insulin sensitivity, particularly in large populations.
The TyG Index as a Risk Marker
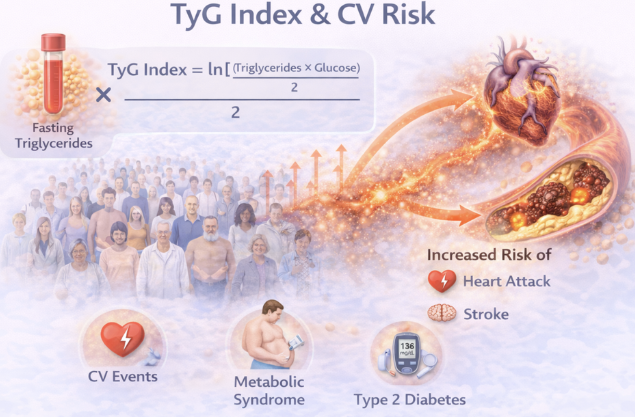
Higher TyG Index values are associated with increased risk of multiple metabolic conditions, including:
- type 2 diabetes
- metabolic syndrome
- fatty liver disease
- hypertension
- cardiovascular disease
These associations suggest that the TyG Index reflects the underlying metabolic environment that predisposes individuals to cardiometabolic disease.
Relationship to Lipid Metabolism
The TyG Index incorporates fasting triglyceride levels, which are closely linked to hepatic lipid metabolism.
Elevated triglycerides often reflect:
- increased hepatic fat accumulation
- overproduction of triglyceride-rich lipoproteins
- altered lipid transport
These processes are also associated with:
- small, dense LDL particles
- reduced HDL cholesterol
- atherogenic dyslipidemia
Thus, the TyG Index provides insight into broader disturbances in lipoprotein metabolism.
Cardiovascular Implications
Cardiovascular disease remains one of the leading causes of death worldwide.
Traditional risk assessment focuses on cholesterol, blood pressure, and lifestyle factors. However, metabolic disturbances such as insulin resistance and dyslipidemia play a major role in vascular disease.
Because the TyG Index reflects both glucose and lipid metabolism, it helps capture underlying metabolic risk that may not be fully reflected in standard measurements alone.
Population Studies
Large epidemiological studies have shown that individuals with higher TyG Index values are more likely to experience:
- cardiovascular events
- progression to type 2 diabetes
- development of metabolic syndrome
These findings reinforce the role of insulin resistance as a unifying mechanism linking multiple metabolic disorders.
Clinical Perspective
In clinical practice, fasting triglycerides and fasting glucose are routinely measured.
The TyG Index therefore requires no additional testing. It can be calculated easily using existing laboratory data, making it practical in both research and real-world settings.
Although it does not replace clinical judgment or formal diagnosis, it can help identify patterns of metabolic risk.
A Broader Metabolic Context
The TyG Index illustrates how metabolic pathways interact across organ systems.
Changes in:
- liver metabolism
- adipose tissue signaling
- insulin regulation
- lipid transport
all influence the triglyceride and glucose levels used in the index.
Rather than representing a single abnormality, the TyG Index reflects a broader state of metabolic stress.
Bottom line
TyG Index: if triglycerides and glucose are both up, insulin resistance is already in play.
Related Topics
Readers interested in the metabolic processes discussed on this page may also explore:
These pages examine the physiological pathways that contribute to metabolic dysfunction.