A Timeline of Policy, Sugar, and the Long Delay in Confronting Fructose
Introduction
For decades, the Dietary Guidelines for Americans have shaped federal nutrition policy, school meals, public messaging, and much of the American food environment. Since 1980, the Guidelines have been updated every five years. But for much of that history, the main emphasis fell on fat, saturated fat, cholesterol, and calorie balance rather than on the metabolic effects of sugar, fructose, and highly processed foods.
That matters because policy language influences what the public notices, what schools serve, what clinicians repeat, and how industry reformulates food. Sugar was often mentioned, but for many years it was not treated as the central metabolic problem. Fructose—especially in the form of liquid sugar and high-fructose corn syrup—remained largely in the background of federal messaging even as the food environment changed rapidly.
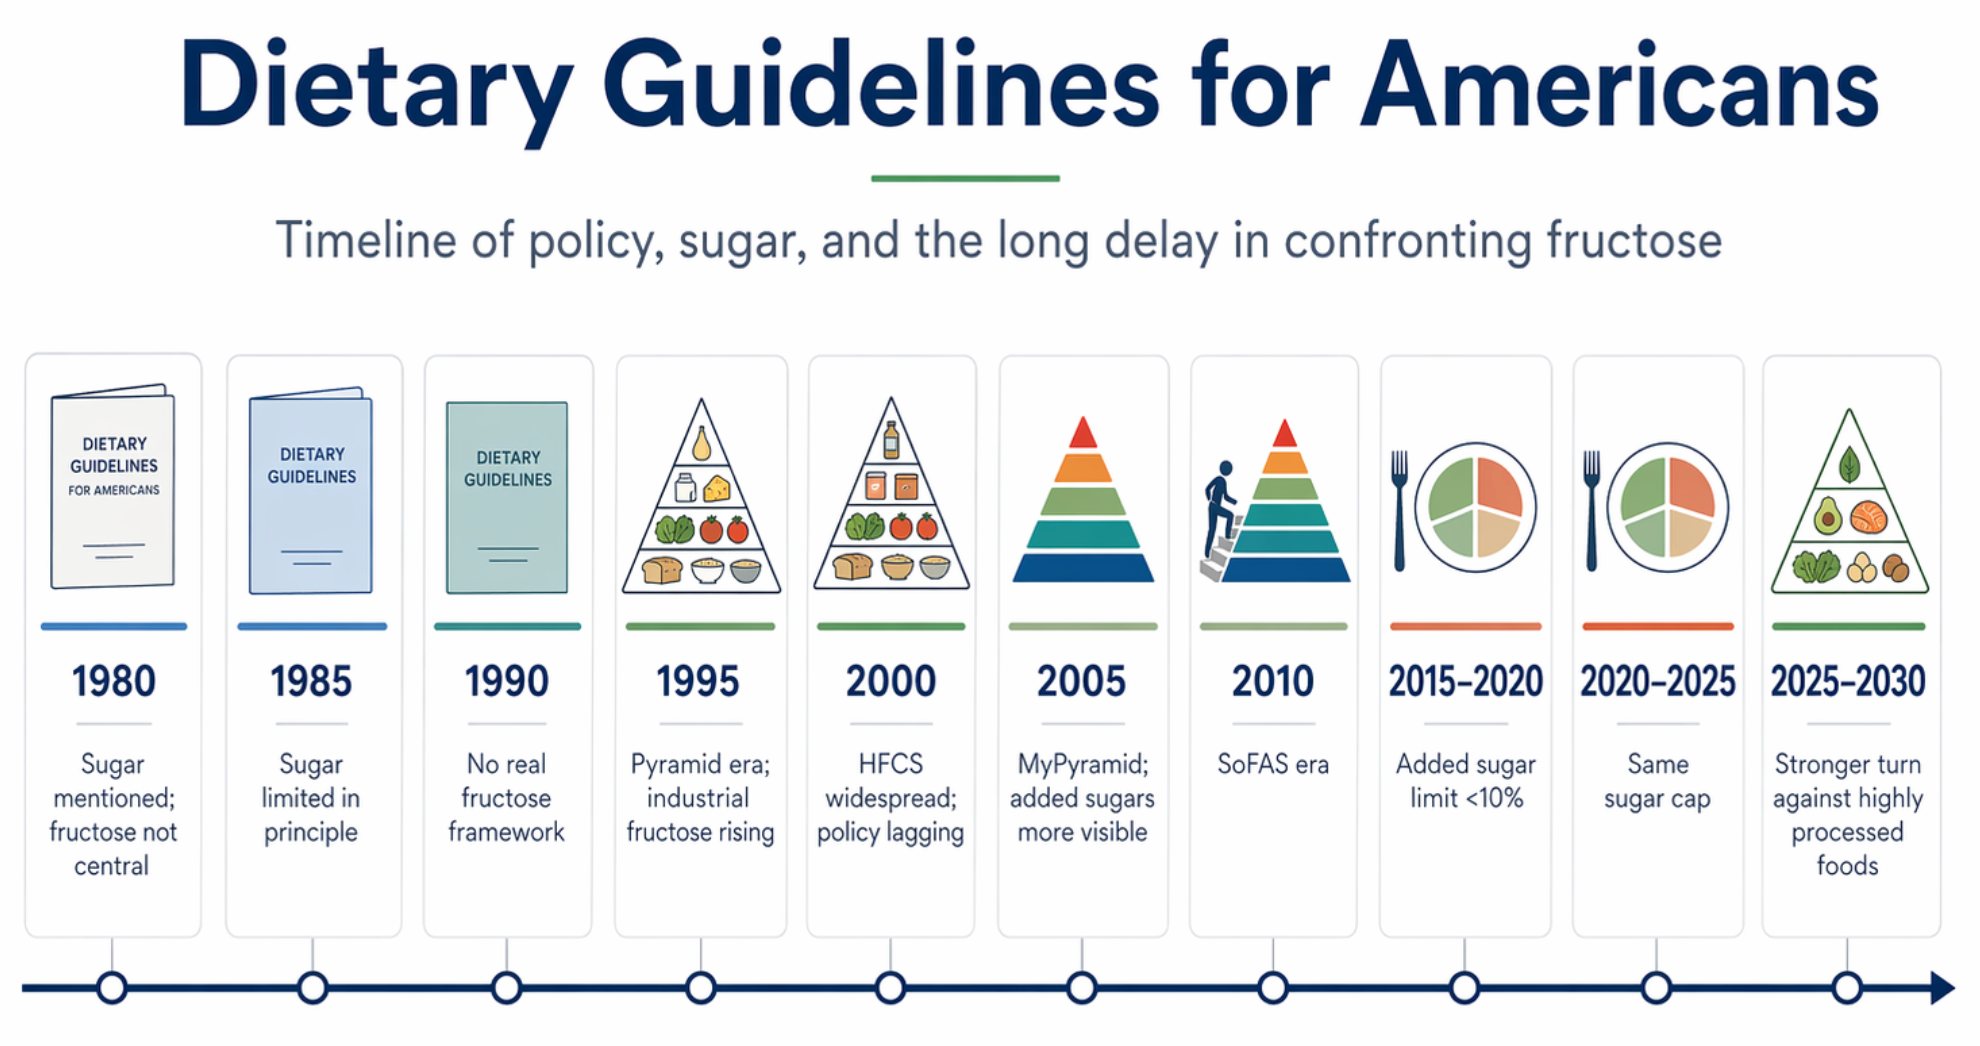
This is a history of what was emphasized, what was minimized, and how slowly policy caught up with metabolic reality.
A useful way to read the history is this:
- 1980–2000: sugar present, but not central
- 2005–2010: added sugars more visible, but fructose still poorly framed
- 2015–2025: explicit added sugar limits
- 2025–2030: much more direct language on highly processed foods, refined carbohydrates, and added sugars
1980 — First Dietary Guidelines for Americans
The first edition of the Dietary Guidelines for Americans was issued in 1980. It marked the beginning of the five-year update cycle that continues today. Sugar was mentioned, and Americans were advised to avoid too much sugar, but sugar was treated broadly—as one dietary excess among several. There was no real discussion of fructose as a special liver-centered metabolic problem.
The broader frame of the period was already moving toward the low-fat era. That would become increasingly important, because once fat became the main public villain, many processed foods could be marketed as healthier while still containing substantial amounts of sugar and refined carbohydrate.

1985 — Sugar still secondary
The 1985 edition continued the same general pattern. Sugar was still something to limit, but it was not presented as the major driver of obesity, diabetes, fatty liver, or metabolic syndrome. Fructose remained essentially invisible as a distinct biologic concern.
This was still an era in which the dominant public-health narrative focused more heavily on fat, cholesterol, and general moderation than on sugar biology.

1990 — Still no true fructose framework
The 1990 edition continued to advise moderation, but it still did not identify fructose as a distinct issue. At this point, the scientific and policy framing remained much more focused on traditional nutrient categories than on the metabolic consequences of rapidly delivered sugar.
The problem was not that sugar was never mentioned. The problem was that it was not yet being treated as a central upstream driver of metabolic disease.
Suggested visual:
- Official 1990 cover

1995 — The Pyramid era, but still weak on sugar biology
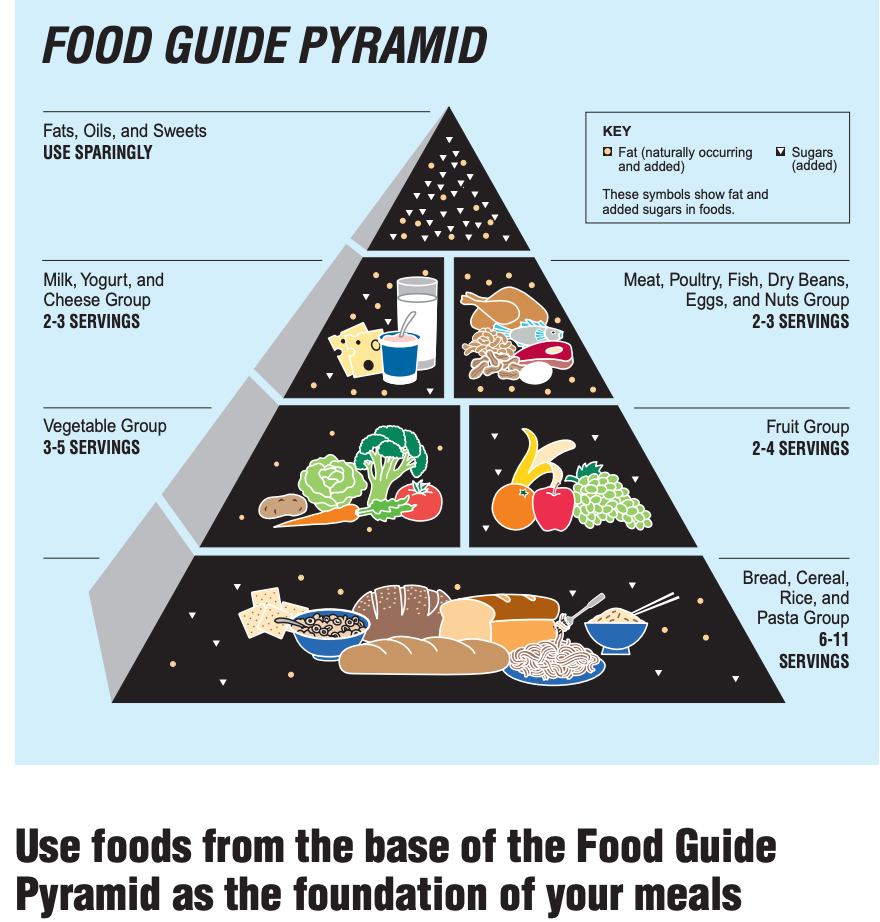
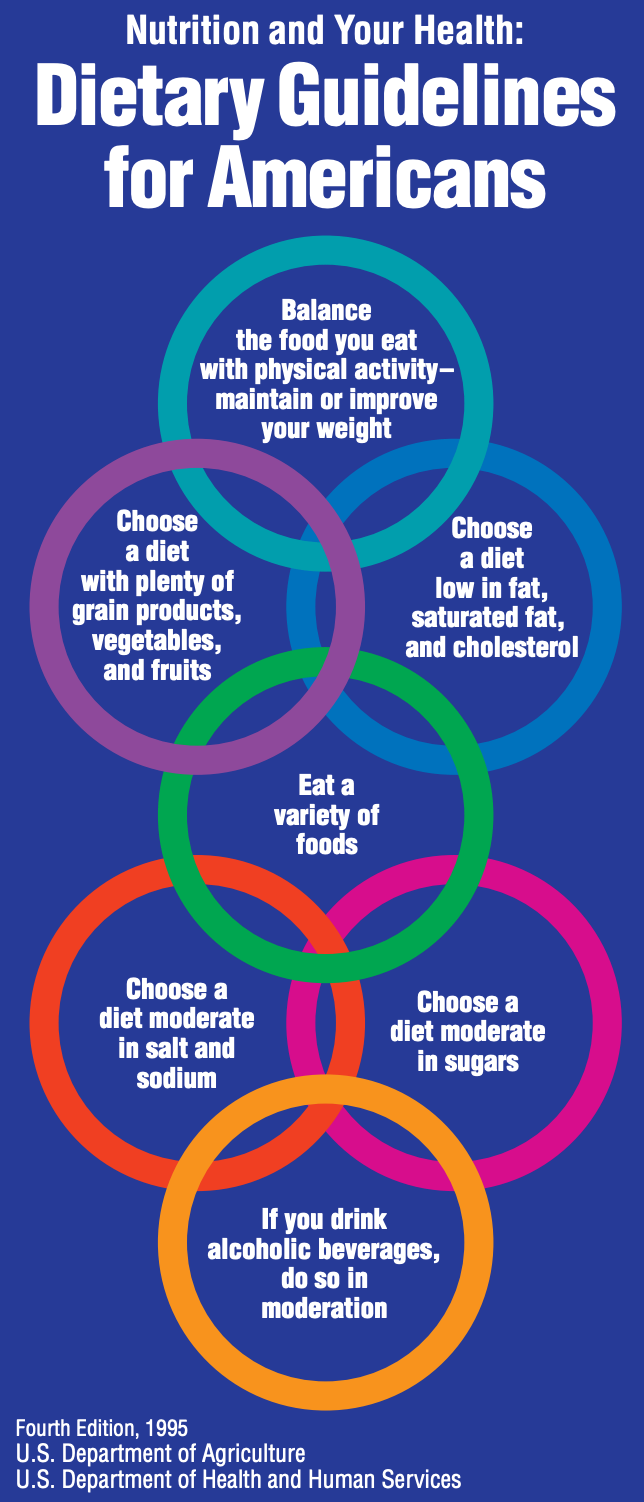
The 1990s introduced the most recognizable nutrition symbol in modern U.S. history: the Food Guide Pyramid, first introduced by USDA in 1992. This makes the Pyramid the natural visual symbol for the 1995 and 2000 guideline era.
By 1995, America was already living deeper in the industrial food era, and the post-1984 expansion of high-fructose corn syrup in beverages and processed foods was well underway. Yet the Guidelines still did not seriously confront fructose as a liver-first metabolic burden. Sugar remained more of a “use sparingly” issue than a biologic explanation for fatty liver, insulin resistance, or hypertriglyceridemia.
2000 — Industrial fructose growing, policy language still lagging
The 2000 edition remained cautious and conventional. Sugar continued to be treated as something to moderate, but there was still no strong policy-level explanation of how fructose behaves differently from glucose, how sugary beverages overwhelm satiety, or how liver metabolism contributes to triglycerides and fatty liver.
This gap matters in hindsight. By then, the metabolic consequences of the modern food environment were becoming increasingly obvious, but official language was still not organized around the biology of fructose exposure.
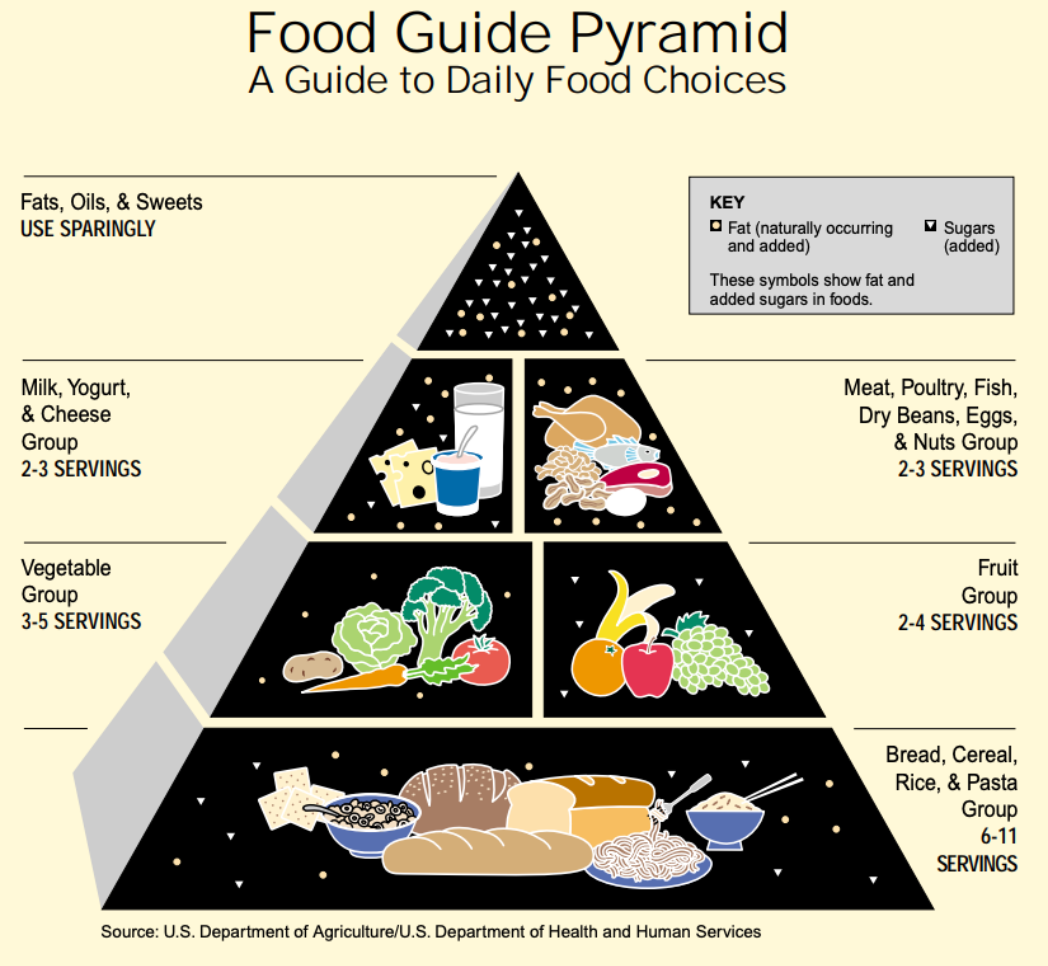

USDA 2000 Dietary Guidelines for Americans
2005 — MyPyramid appears, added sugars more visible
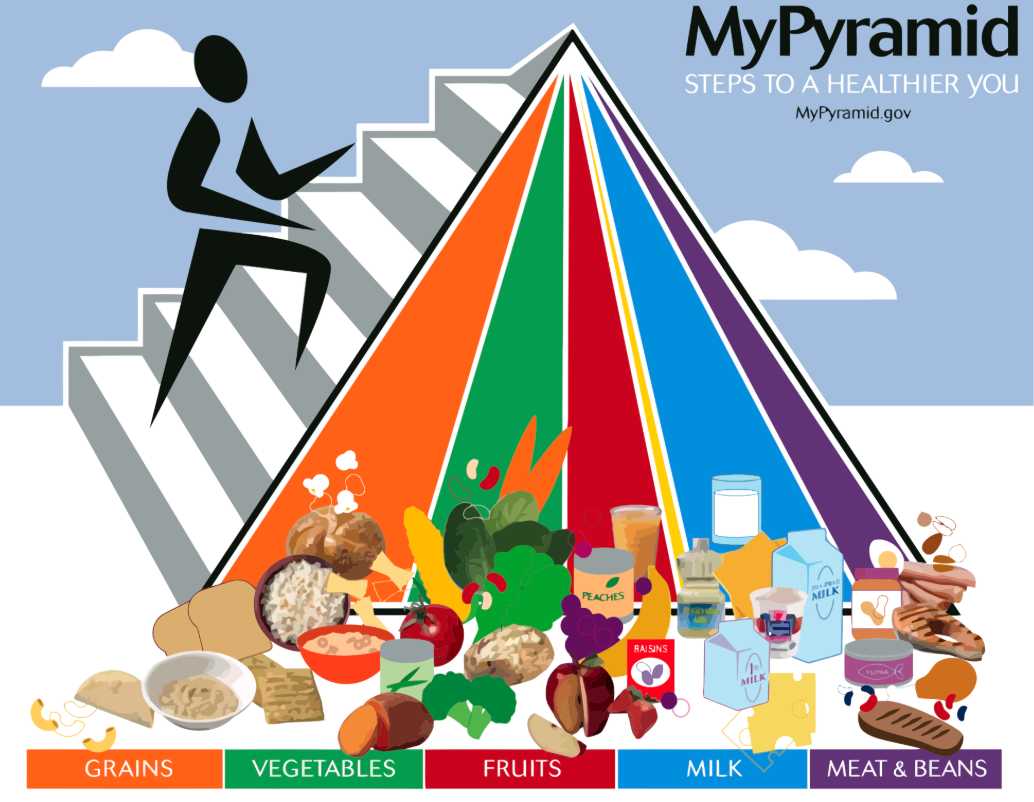
In 2005, USDA replaced the old Pyramid with MyPyramid, the vertical-striped design that tried to modernize the message. It is the defining icon of the 2005 guideline era.
Substantively, the 2005 edition moved somewhat closer to the sugar problem by speaking more clearly about limiting added sugars. But fructose was still not framed explicitly as a major hepatic and metabolic issue. The idea that fructose could drive liver fat, elevated triglycerides, uric acid generation, and insulin resistance still sat mostly outside the public-facing federal narrative.

2010 — SoFAS: a step closer
The 2010 edition took a clearer step by emphasizing reduction of calories from solid fats and added sugars, often summarized as the SoFAS era. This was an important shift. Sugar became more visible as a public-health issue, even if fructose itself still remained largely unnamed in the broader metabolic sense.
This was progress, but it was still incomplete. The language still did not really teach the public that fructose is handled primarily by the liver, that sugary beverages are especially problematic, or that repeated exposure contributes to fatty liver and metabolic syndrome.


2015–2020 — Added sugar limit becomes explicit
The 2015–2020 Guidelines marked a more important turning point. For the first time, the Guidelines explicitly recommended limiting added sugars to less than 10% of daily calories. That was a significant policy acknowledgment.
This still was not the same as saying “fructose is a central metabolic problem,” but it was clearly closer. By this stage, federal guidance was finally beginning to recognize that sugar was not merely a minor indulgence issue, but a meaningful dietary burden.
The visual symbol for this period is MyPlate, which USDA introduced in 2011 to replace the pyramid format.
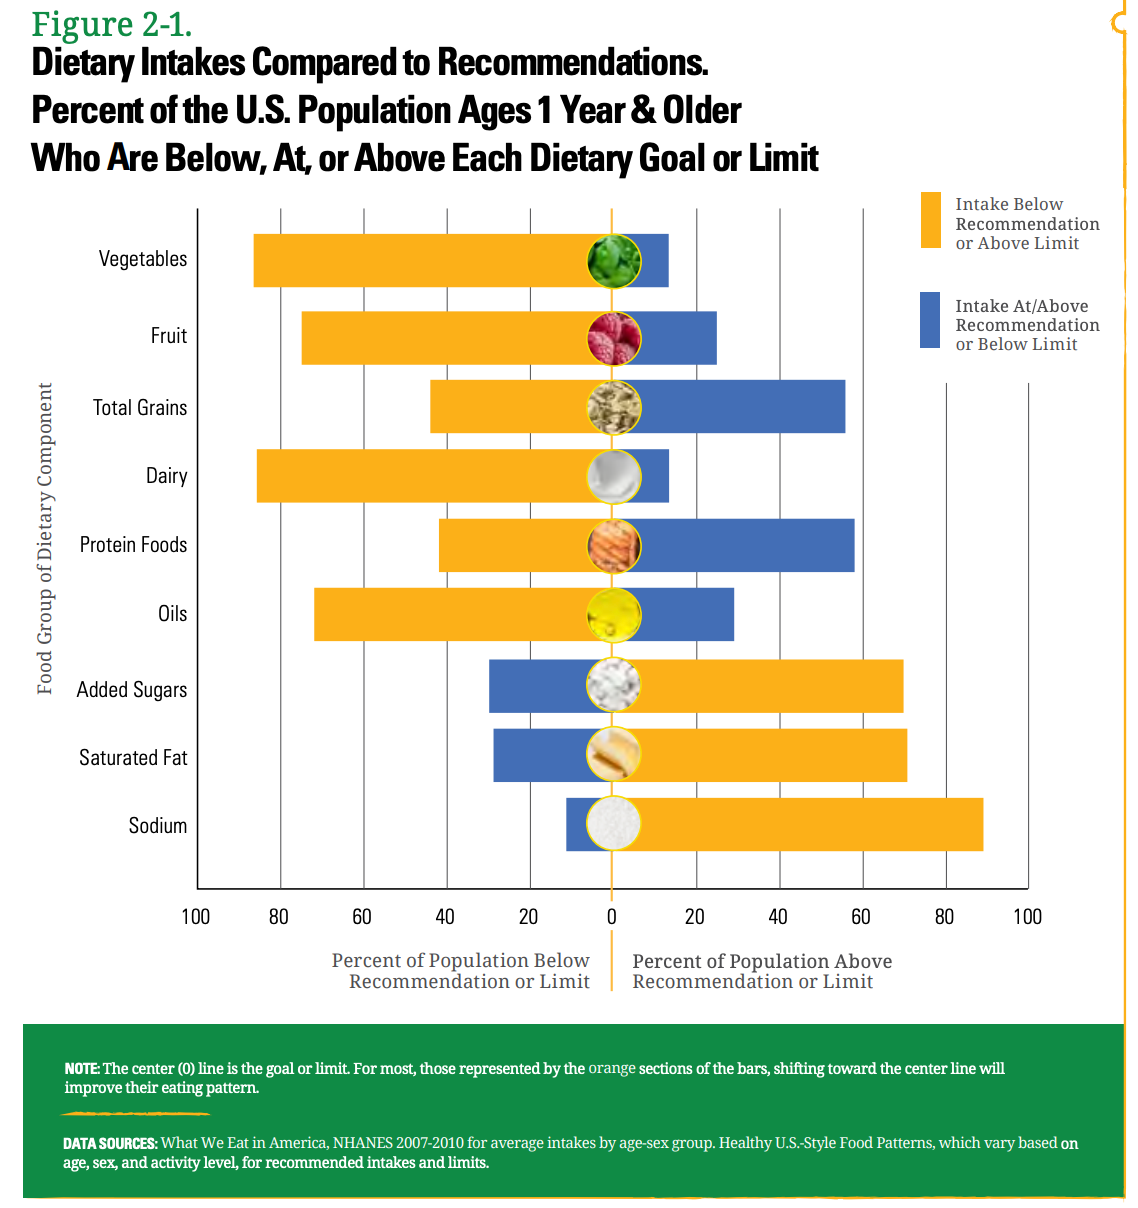

2020–2025 — Same sugar cap, but fructose still mostly implicit
The 2020–2025 edition maintained the recommendation that added sugars remain below 10% of calories. This showed continuity and confirmed that sugar had moved much closer to the center of policy concern than in earlier decades.
Even so, the language still generally referred to added sugars rather than explaining in detail the distinct biologic effects of fructose, liquid sugar, high-fructose corn syrup, liver fat accumulation, and uric acid generation. In other words, sugar had become visible, but fructose metabolism was still largely implicit.
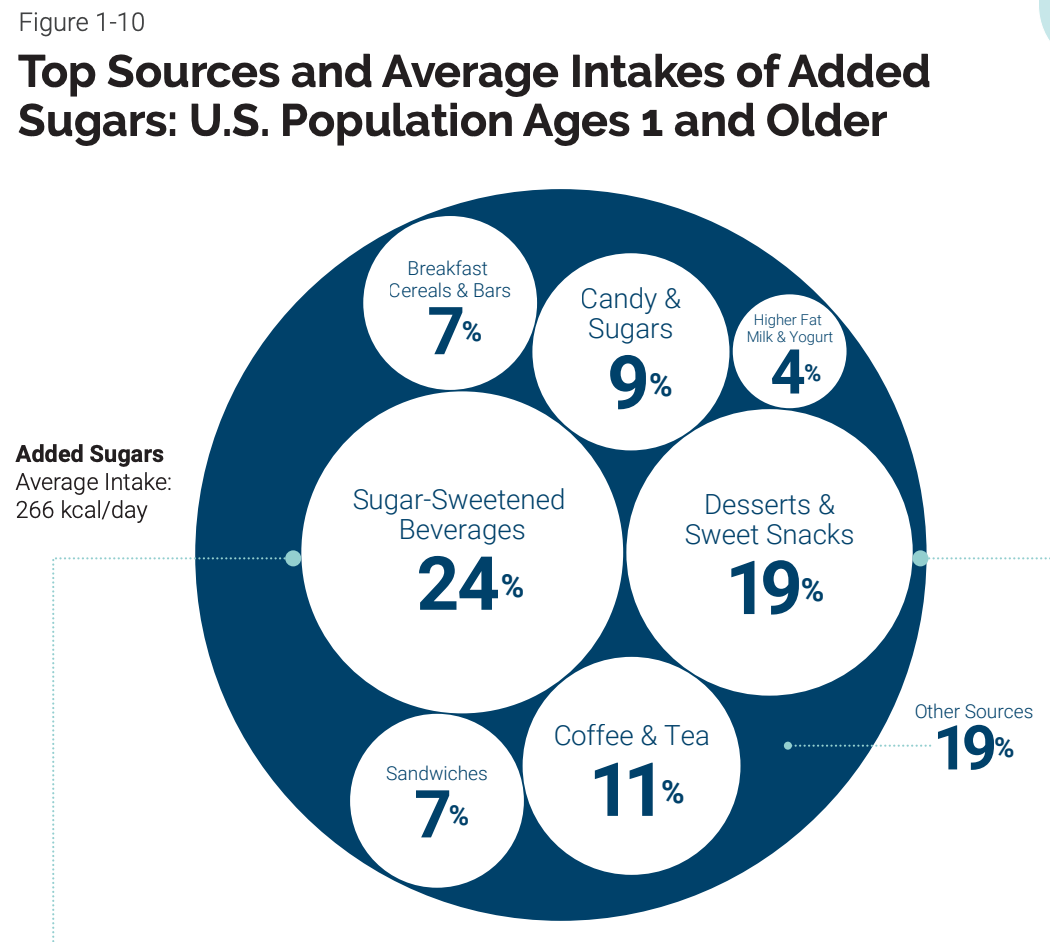

2025–2030 — A stronger turn toward real food and away from industrial sugar
The current edition, Dietary Guidelines for Americans, 2025–2030, was published in 2026 and, according to the official Dietary Guidelines history page, was released “with new visual icon” and links to a new food pyramid at RealFood.gov.
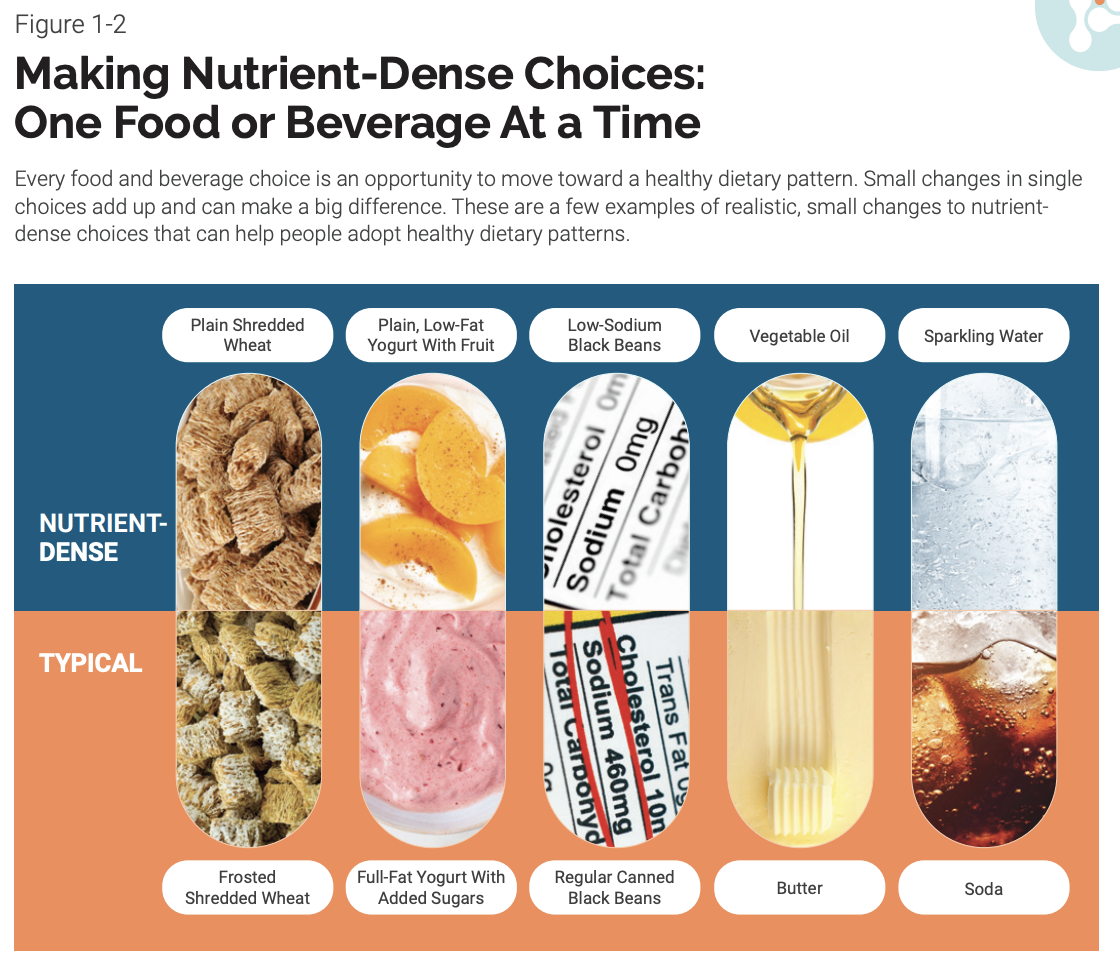
This edition appears to be the strongest turn yet toward confronting the modern food environment more directly. Official materials emphasize limiting highly processed foods, added sugars, and refined carbohydrates, which is much closer to the actual metabolic problem faced by the public today.
Even here, the language may still not always isolate fructose as sharply as metabolic clinicians would like, but the direction is clearer than before. After decades of relative delay, federal policy language is finally moving closer to the real pattern: industrial processing, refined carbohydrate, and repeated sugar exposure matter enormously.
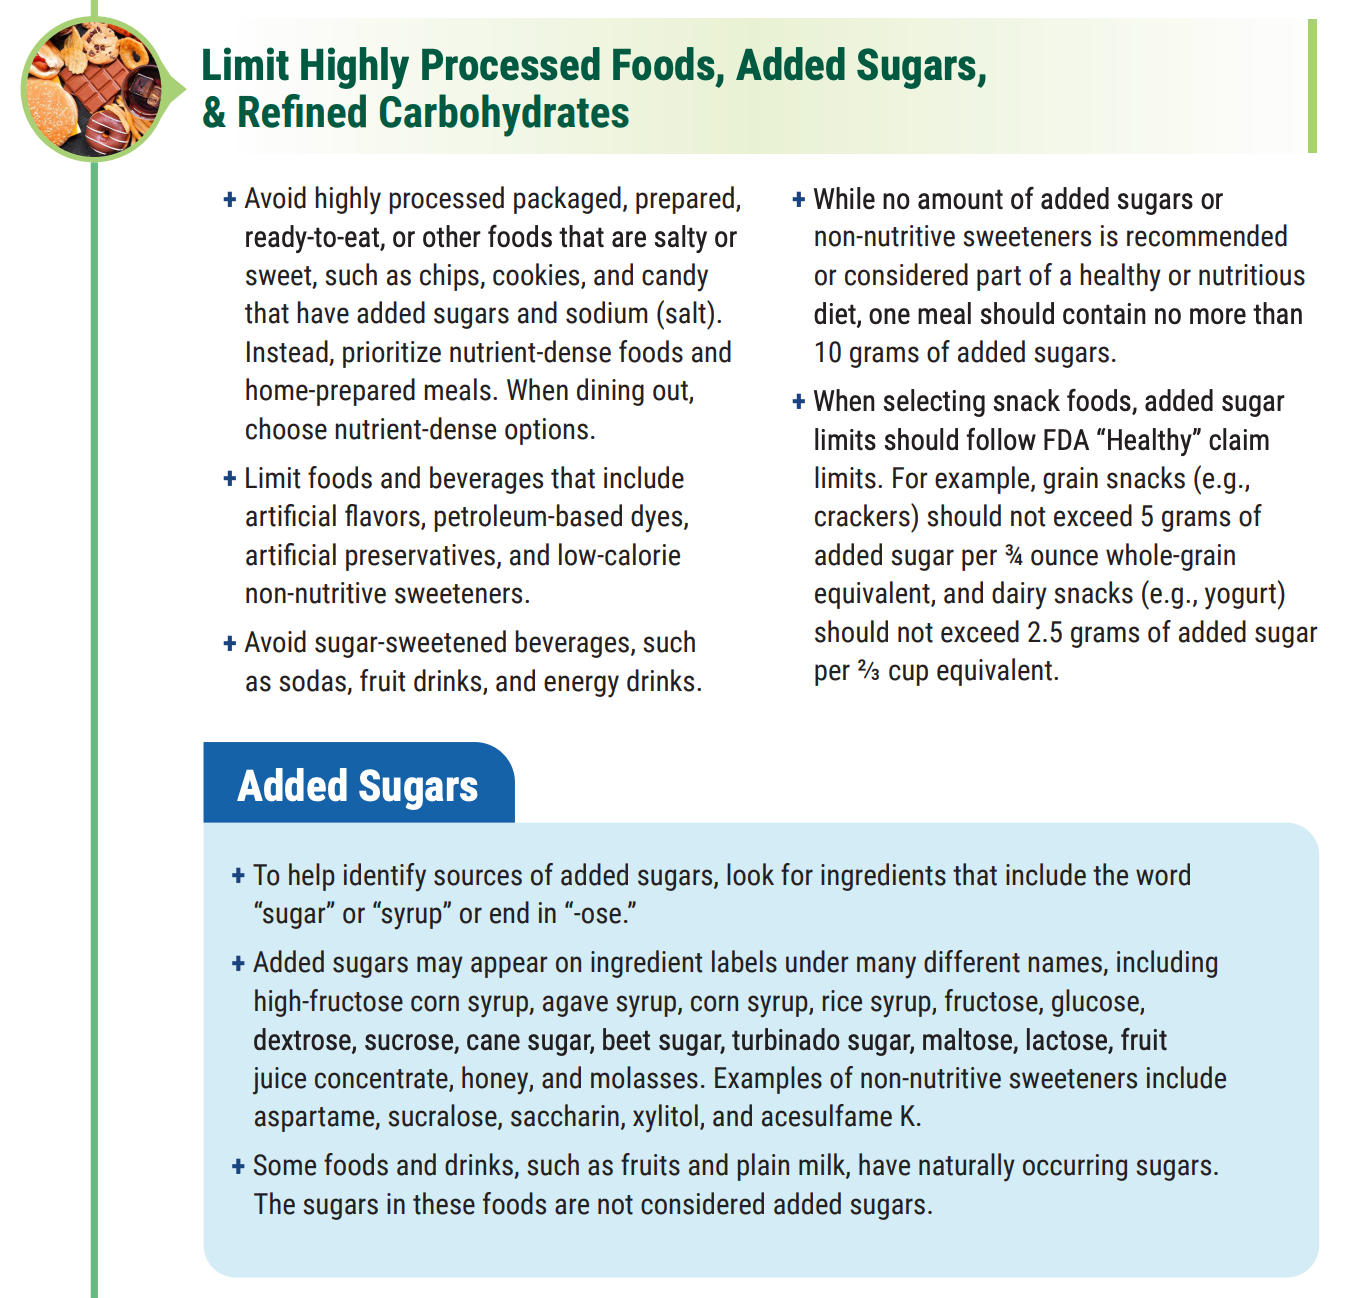
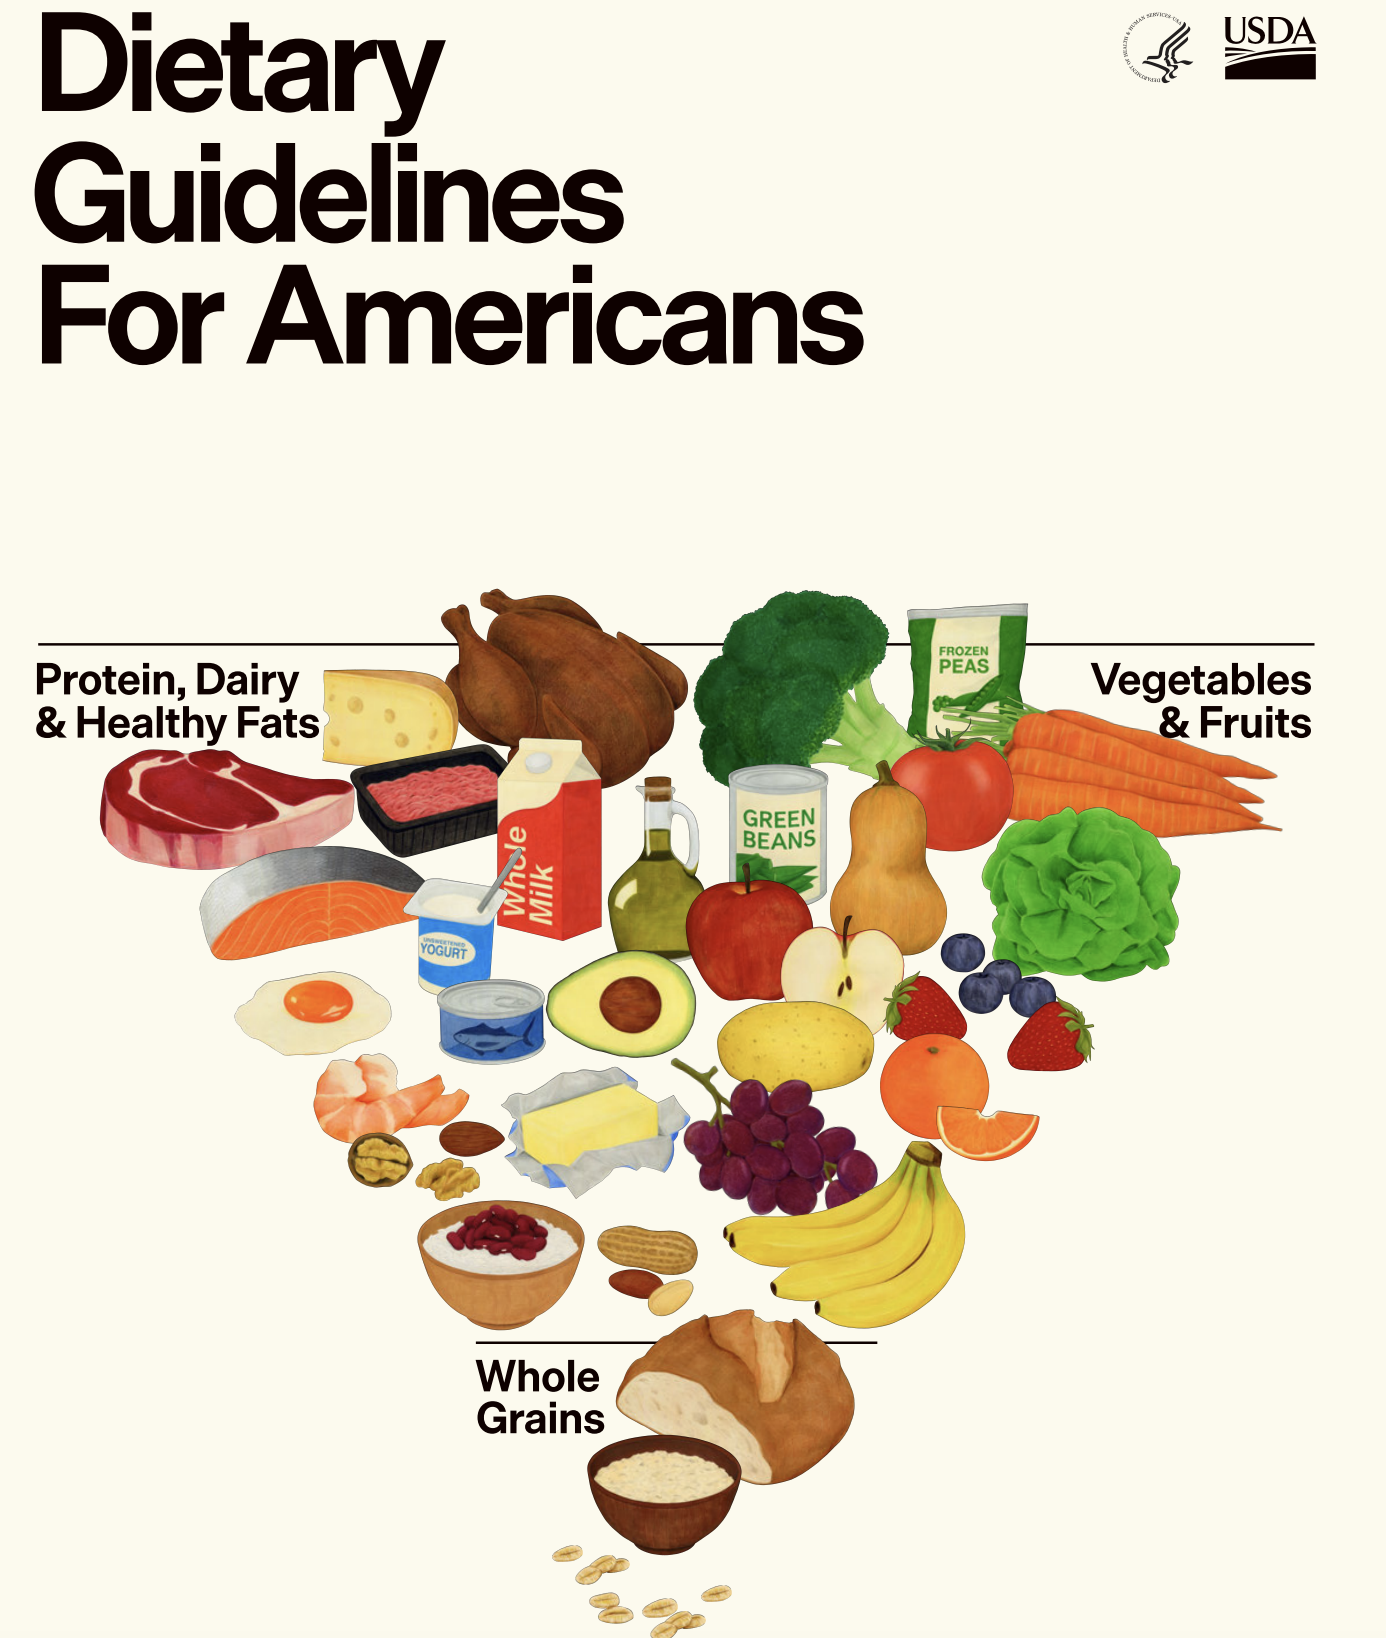
The message of the new USDA Dietary Guidelines is blunt and simple: eat real food — whole, minimally processed, nutrient‑rich foods.
Protein is central — guidance now says to prioritize high‑quality protein at every meal with higher recommended intake levels than past editions.
Full‑fat dairy (without added sugars) is explicitly included as a healthy option — a sharp departure from decades of low‑fat emphasis.
Fruits and vegetables are stressed in whole form throughout the day.
Healthy fats from foods like olives, nuts, seeds, eggs, seafood, and even traditional animal fats are incorporated. Whole grains are preferred, but refined carbohydrates are substantially reduced in priority.
For the first time, the guidelines name and discourage highly processed foods, added sugars, and artificial additives.
Drinking water and unsweetened beverages are emphasized; alcohol guidance is more moderate than past editions. They also present a new food pyramid that visually reorganizes food priorities — reflecting this real‑food message.
What the timeline shows
Taken together, the Dietary Guidelines timeline shows a long delay in confronting the true metabolic implications of sugar.
For decades:
- sugar was present, but not central
- fructose was rarely treated as a distinct biologic issue
- policy language focused more heavily on fat and calories
- the food environment grew steadily more industrial, more refined, and more sugar-saturated
Only gradually did the Guidelines begin to move toward more direct language on added sugars, and only recently have they come closer to the larger problem of highly processed foods, refined carbohydrates, and industrial sugar exposure.
Why this matters now
This new edition of the USDA dietary guidelines also nudges federal policy and programs (like school meals and feeding programs) toward emphasizing real, nutrient‑rich meals over ultra‑processed convenience options — with major implications for public health initiatives.
Building toward personalization
Although the core DGAs remain population‑level advice, conversations around why the same “healthy plate” works differently from person to person are gaining traction in academic and clinical nutrition circles. This ties into ongoing research suggesting that genes, metabolism, and individual biology help explain varied responses to identical diets — precisely where the next frontier of dietary guidance is headed. (This isn’t yet codified in the DGAs themselves, but it’s steadily entering the research and clinical dialogue.)
In short: the 2025–2030 DGAs mark a firmer break from vague moderation toward clear limits on sugar and processed foods, and they’re positioned at the leading edge of the shift from one‑size‑fits‑all nutrition advice to something that will soon need to account for individual biology and genetics.
Primary References
- Kearns CE, Schmidt LA, Glantz SA. Sugar industry and coronary heart disease research: A historical analysis of internal industry documents. JAMA Internal Medicine. 2016;176(11):1680–1685. https://doi.org/10.1001/jamainternmed.2016.5394
- Takasaki Y. Production of fructose by immobilized glucose isomerase. Agricultural and Biological Chemistry. 1966;30(12):124–130. https://doi.org/10.1271/bbb1961.30.124
- Alberti KGMM, Zimmet PZ. Definition, diagnosis and classification of diabetes mellitus and its complications: Report of a WHO consultation. Diabetic Medicine. 1998;15(7):539–553. https://doi.org/10.1007/PL00010601
- Yang Q, Zhang Z, Gregg EW, et al. Added sugar intake and cardiovascular diseases mortality among U.S. adults. Circulation. 2014;129(18):1793–1801. https://doi.org/10.1161/CIRCULATIONAHA.113.004836
- Malik VS, Li Y, Pan A, et al. Long-term consumption of sugar-sweetened and artificially sweetened beverages and risk of mortality in U.S. adults. Journal of the American Heart Association. 2019;8(15):e011585. https://doi.org/10.1161/JAHA.118.011585
- Singh GM, Micha R, Khatibzadeh S, et al. Estimated global, regional, and national disease burdens related to sugar-sweetened beverage consumption. BMJ. 2015;351:h3576. https://doi.org/10.1136/bmj.h3576
- Lustig RH, Schmidt LA, Brindis CD. The toxic truth about sugar. Nature. 2012;482(7383):27–29. https://doi.org/10.1038/482027a
- Lustig RH. Fructose: metabolic, hedonic, and societal parallels with ethanol. Journal of Hepatology. 2012;56(4):951–963. https://doi.org/10.1016/j.jhep.2012.02.014
- Ostrander LD Jr., Lamphiear DE, Block WD, et al. Relationships of dietary intake to coronary heart disease: Tecumseh Community Health Study. American Journal of Clinical Nutrition. 1967. (Pre-DOI era; archival citation)
- U.S. Food and Drug Administration. Affirmation of GRAS status for high fructose corn syrup (HFCS-42). Federal Register. May 23, 1983;48 FR 21530. https://www.govinfo.gov/app/details/FR-1983-05-23
- U.S. Food and Drug Administration. Extension of GRAS status for high fructose corn syrup (HFCS-55). Federal Register. June 13, 1988;53 FR 22342. https://www.govinfo.gov/app/details/FR-1988-06-13
- New York Times. Coca-Cola and Pepsi will switch to high-fructose corn syrup. November 7, 1984; Section D, Page 6. https://www.nytimes.com/1984/11/07/business/coke-and-pepsi-switch-sweeteners.html
- Bellatti A. The Academy of Nutrition and Dietetics, corporate sponsorship and the alternative: dietitians for professional integrity. British Journal of Sports Medicine. 2019;53(16):986. https://doi.org/10.1136/bjsports-2017-098642
- Mialon M, Serodio P, Crosbie E, et al. Food industry influence on the Academy of Nutrition and Dietetics. Public Health Nutrition. 2022;25(10):2798–2809. https://doi.org/10.1017/S1368980022001835
Related pages
History of Sugar (pre-1984)
Industrial Fructose Era (Post-1984)
Guidelines from Other Countries
Ultra-Processed Foods and the Modern Diet
Metabolic Biochemistry